Two markets. The same bigger picture. Follow the framework, then see how Gold and Silver developed on 12 November 2026.
This walkthrough connects the higher-timeframe reversal context with the pullback, confirmation and target. The charts show selected historical examples, not a signal to trade now.
01 / THE FRAMEWORK
Start with the bigger picture.
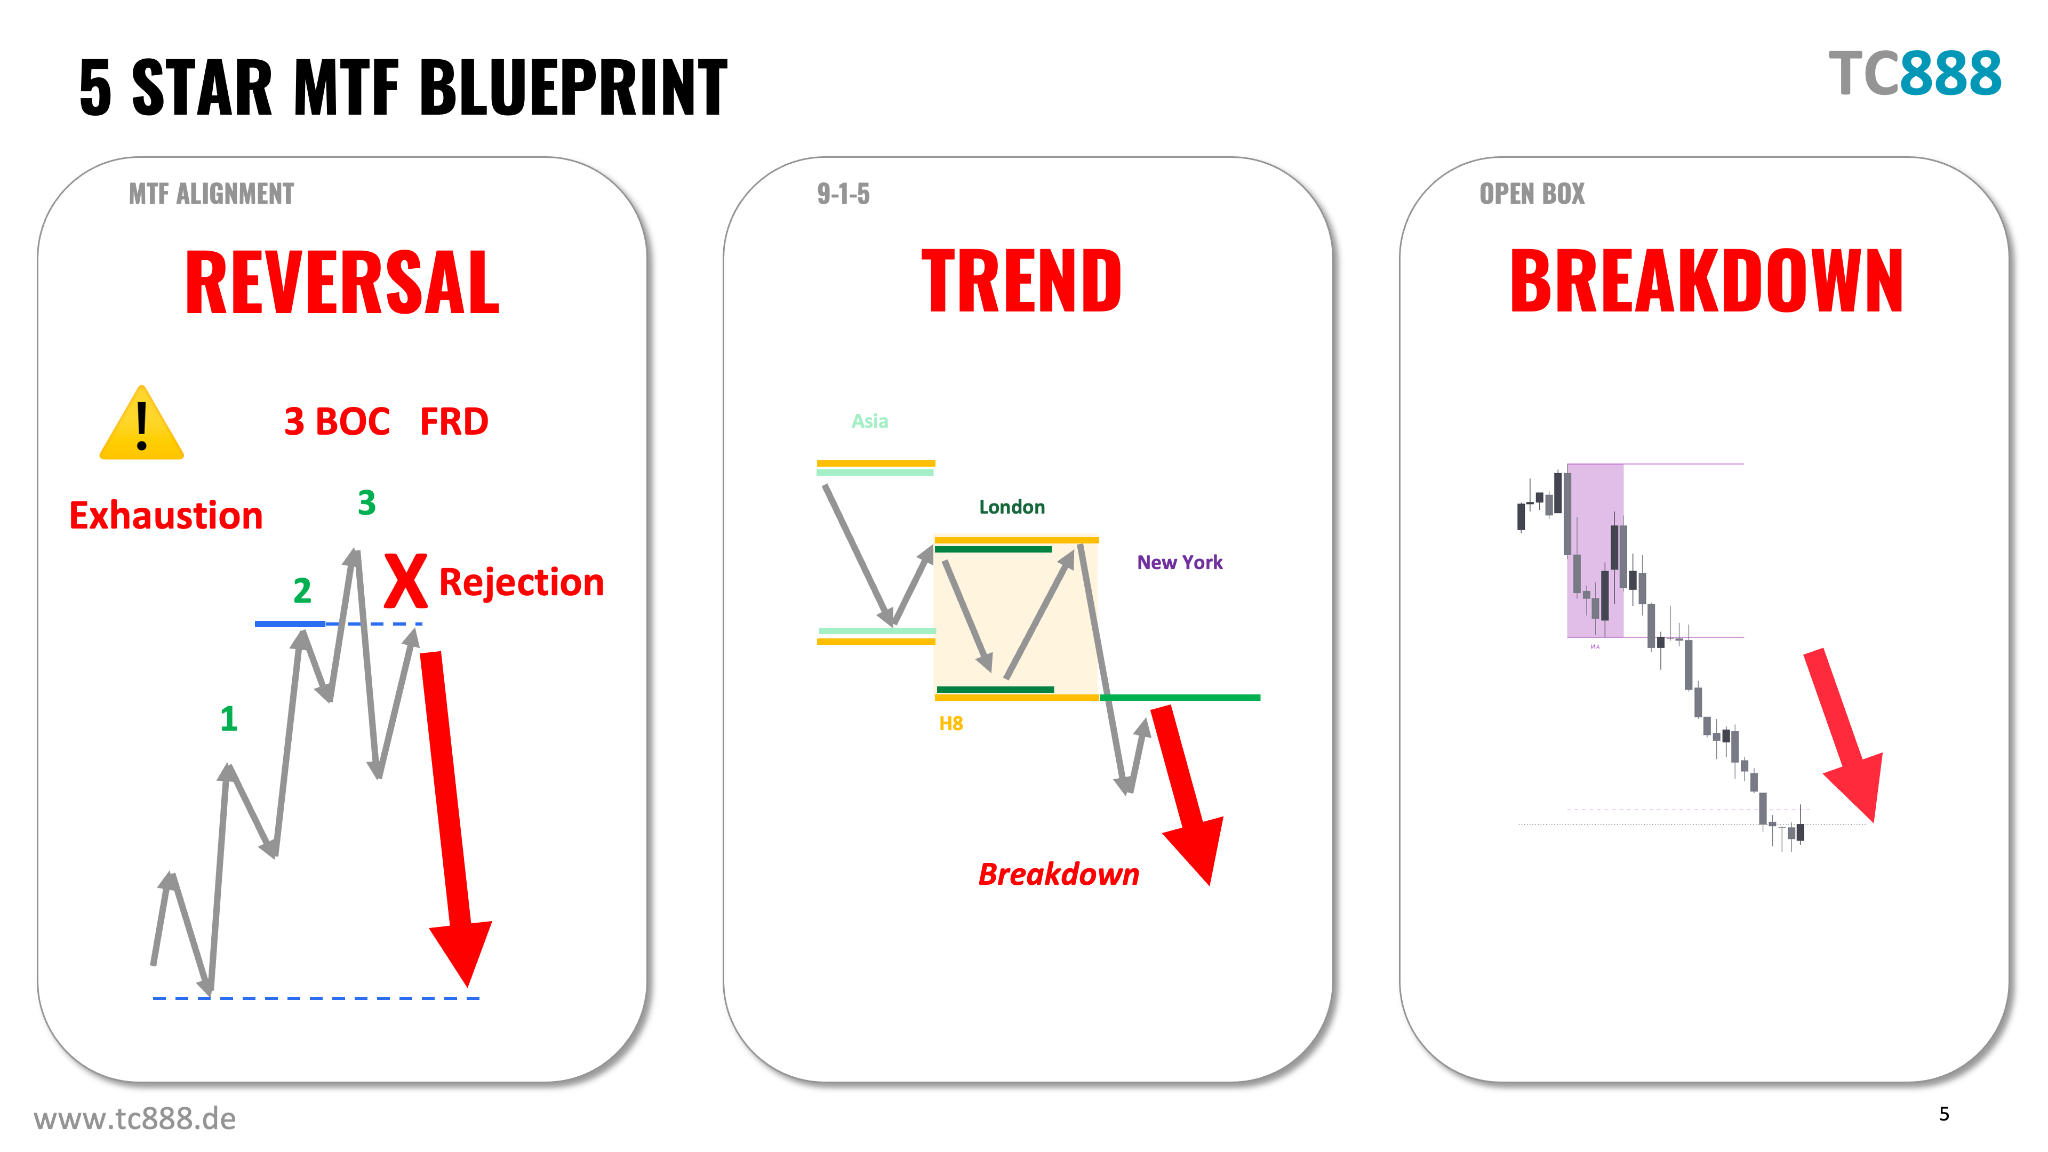
The 5-Star blueprint brings together the reversal context, the 9-1-5 trend view and the Open Box breakdown. Read the sequence first, then look for the execution opportunity in the right context.
Teaching schematic, not a trade chart. Open the image to inspect the original.
01 / CONTEXT
Recognise the reversal setting.
Locate the 3 BOC / FRD sequence and the relevant higher-timeframe levels.
02 / CONFIRMATION
Wait for price to respond.
Follow the pullback and renewed rollover. A familiar pattern alone is not an entry.
03 / EXECUTION
Know the room to the target.
Define invalidation and risk before acting. Keep the target and the session timing in view.
02 / THE SEQUENCE
From overextension to rollover.
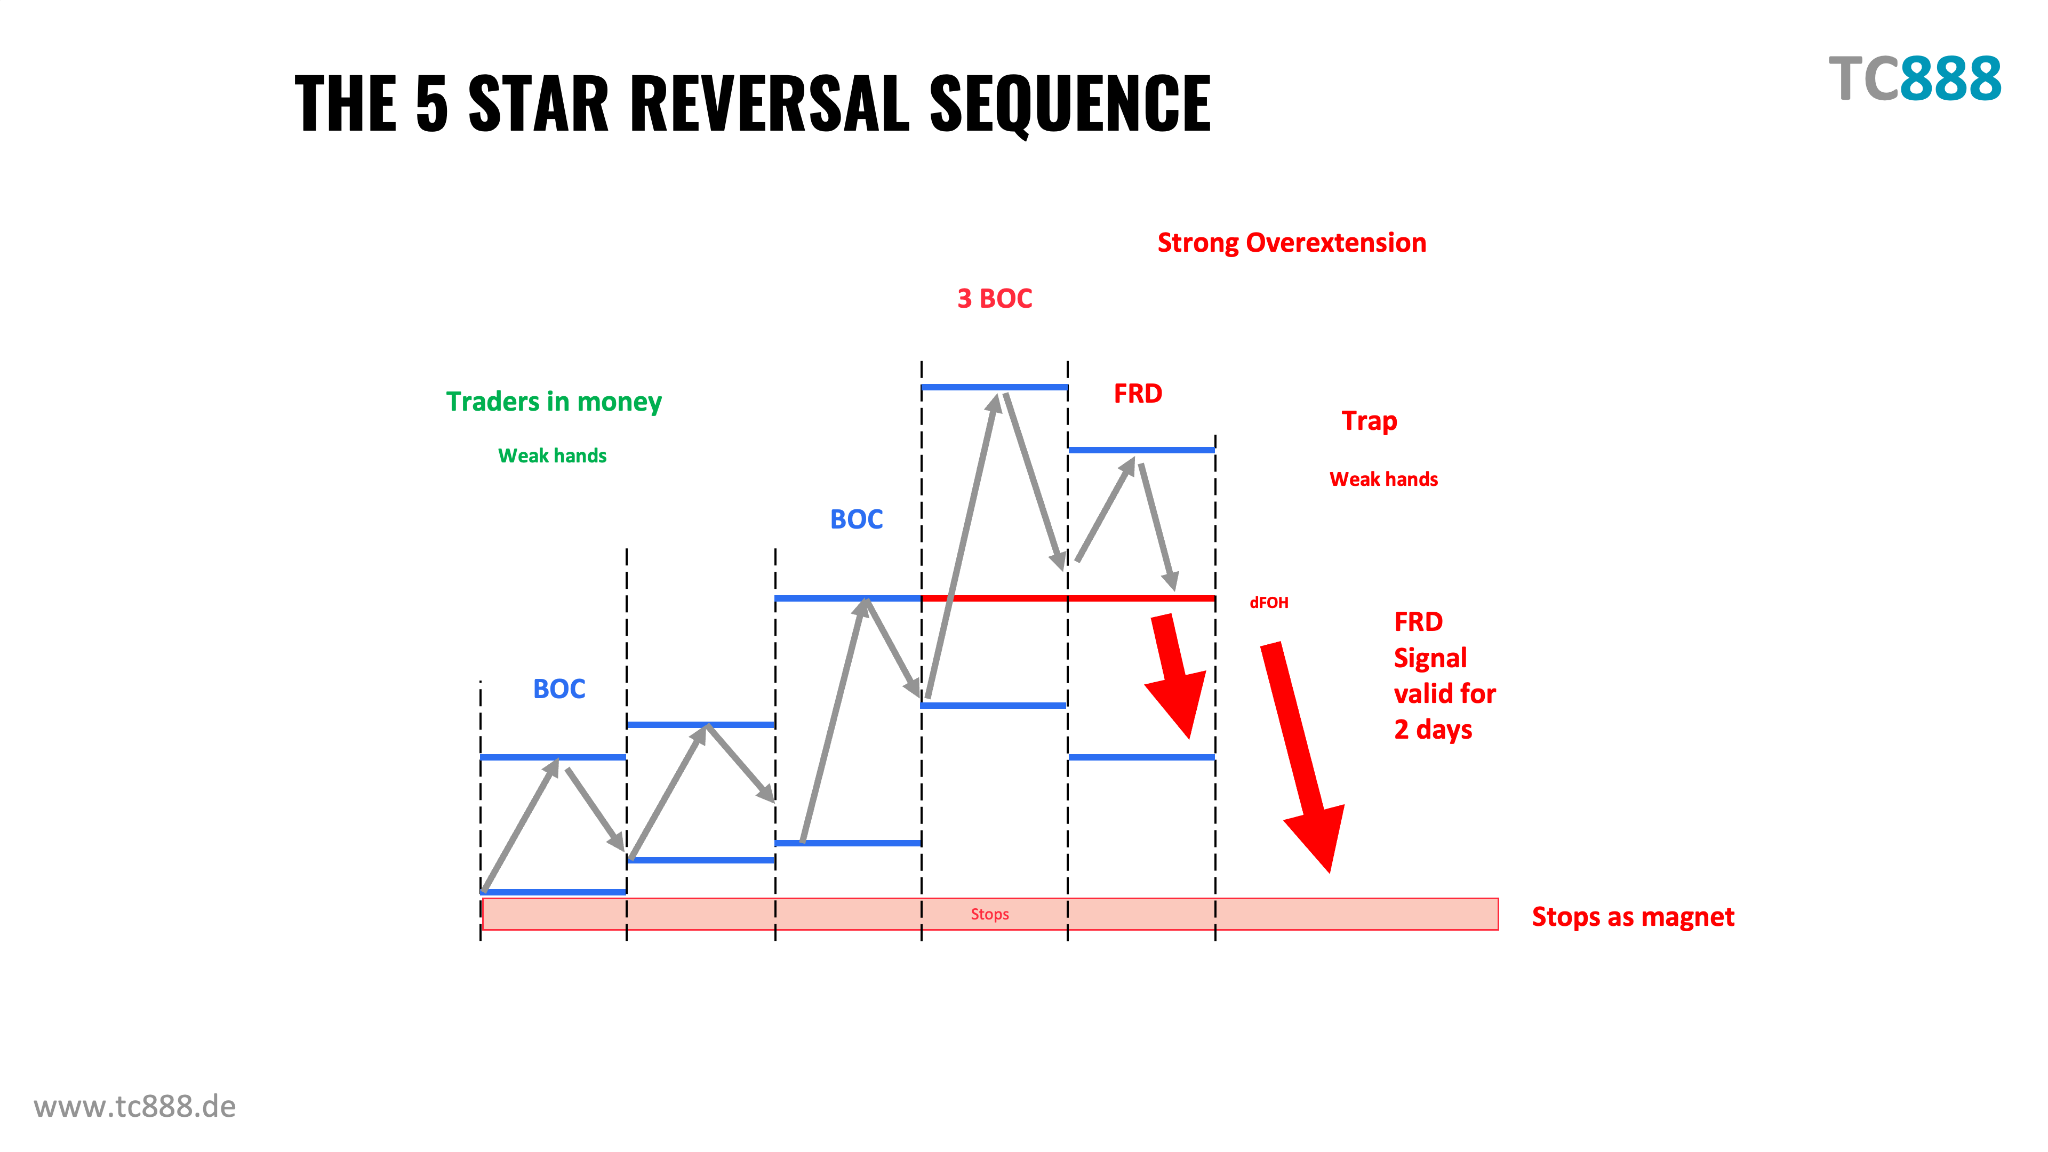
The sequence diagram shows the relationship between the rising BOC structure, strong overextension, the FRD / trap and the downside liquidity reference.
The diagram’s “FRD Signal valid for 2 days” is a signal-validity window within this framework. It is not a required holding period or a guarantee of a move.
03 / 12 NOVEMBER 2026
Gold and Silver in practice.
Both examples show a pullback rolling over into a downtrend. The focus is the decision sequence: context, renewed confirmation and a defined target.
GOLD / MGC1!
The pullback into the rollover.
Historical trade
Context
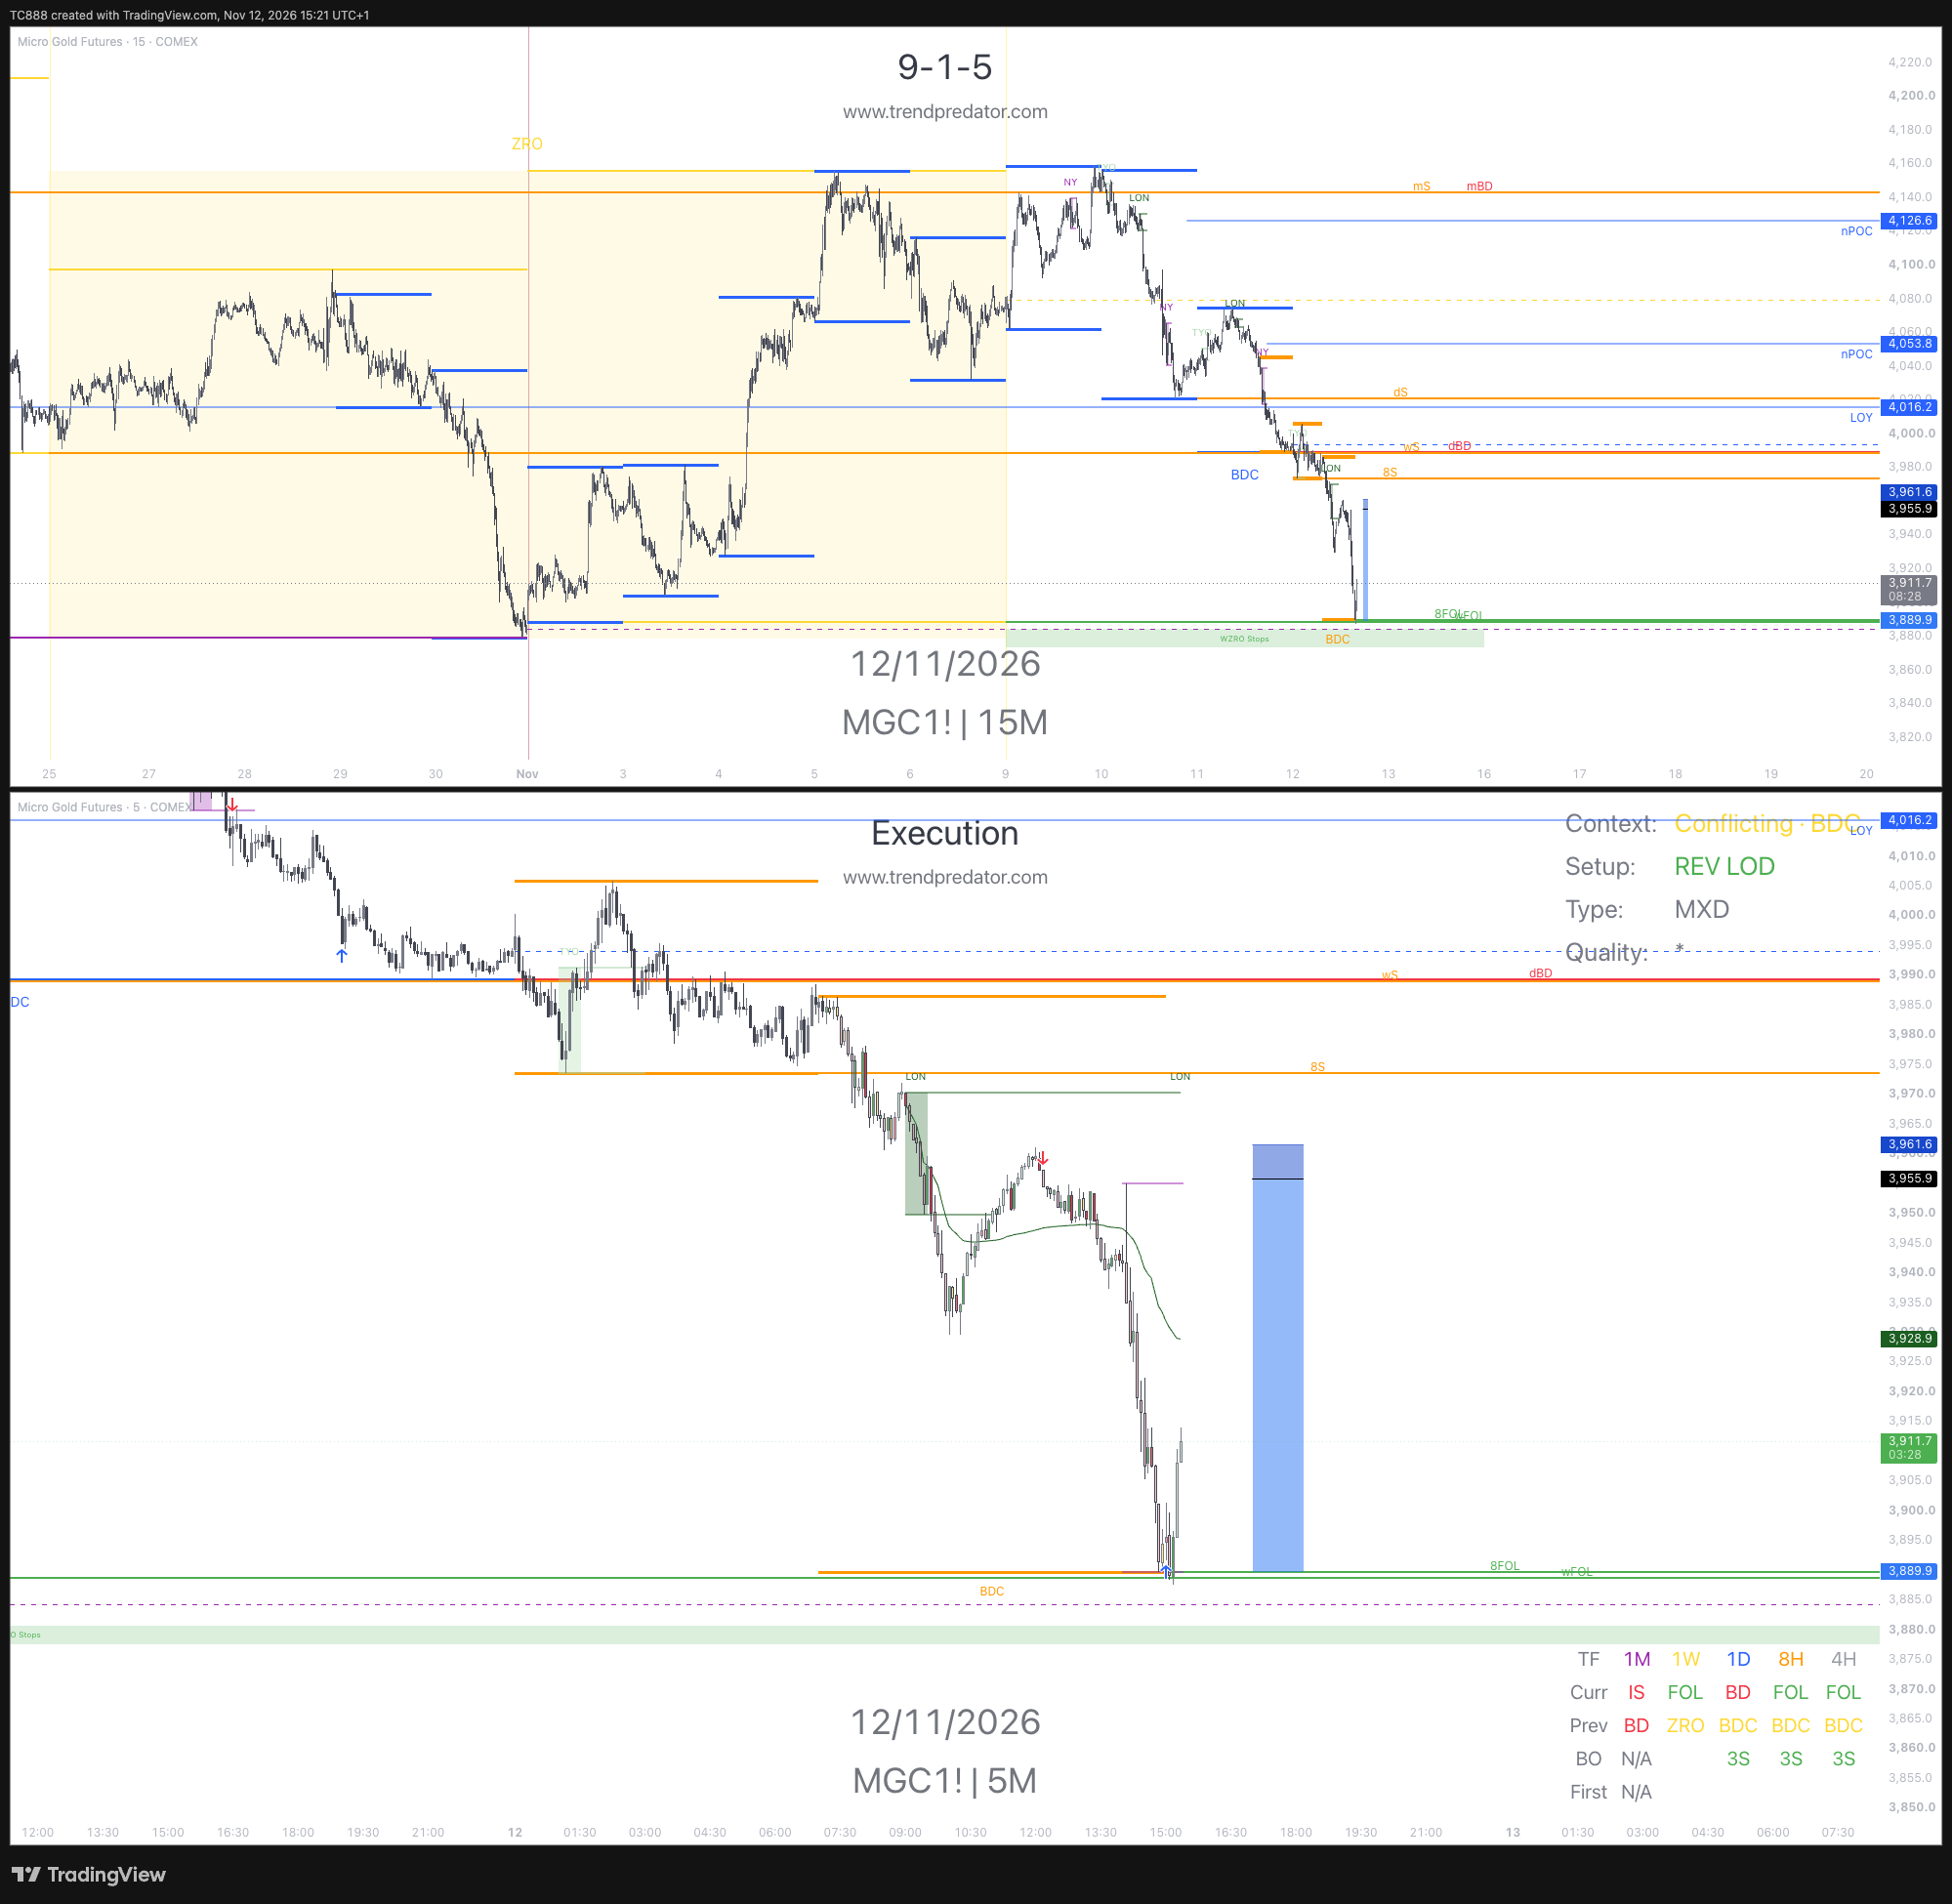
Week Zero triggered at the high, followed by the London first-mouse breakdown.
Entry explanation
After the pullback, the switch-bar rollover provided the execution trigger. Entry was reported at 12:10.
Target and development
The Week Zero lows were the target, reached almost three hours later.
Original full-resolution chart. Tap to enlarge. Entry time is reproduced as posted; its time convention has not been independently verified.
Matthias reported “660p / R11” for a half-size runner.
SILVER / SIL1!
Losing H8 again.
Historical trade
Context
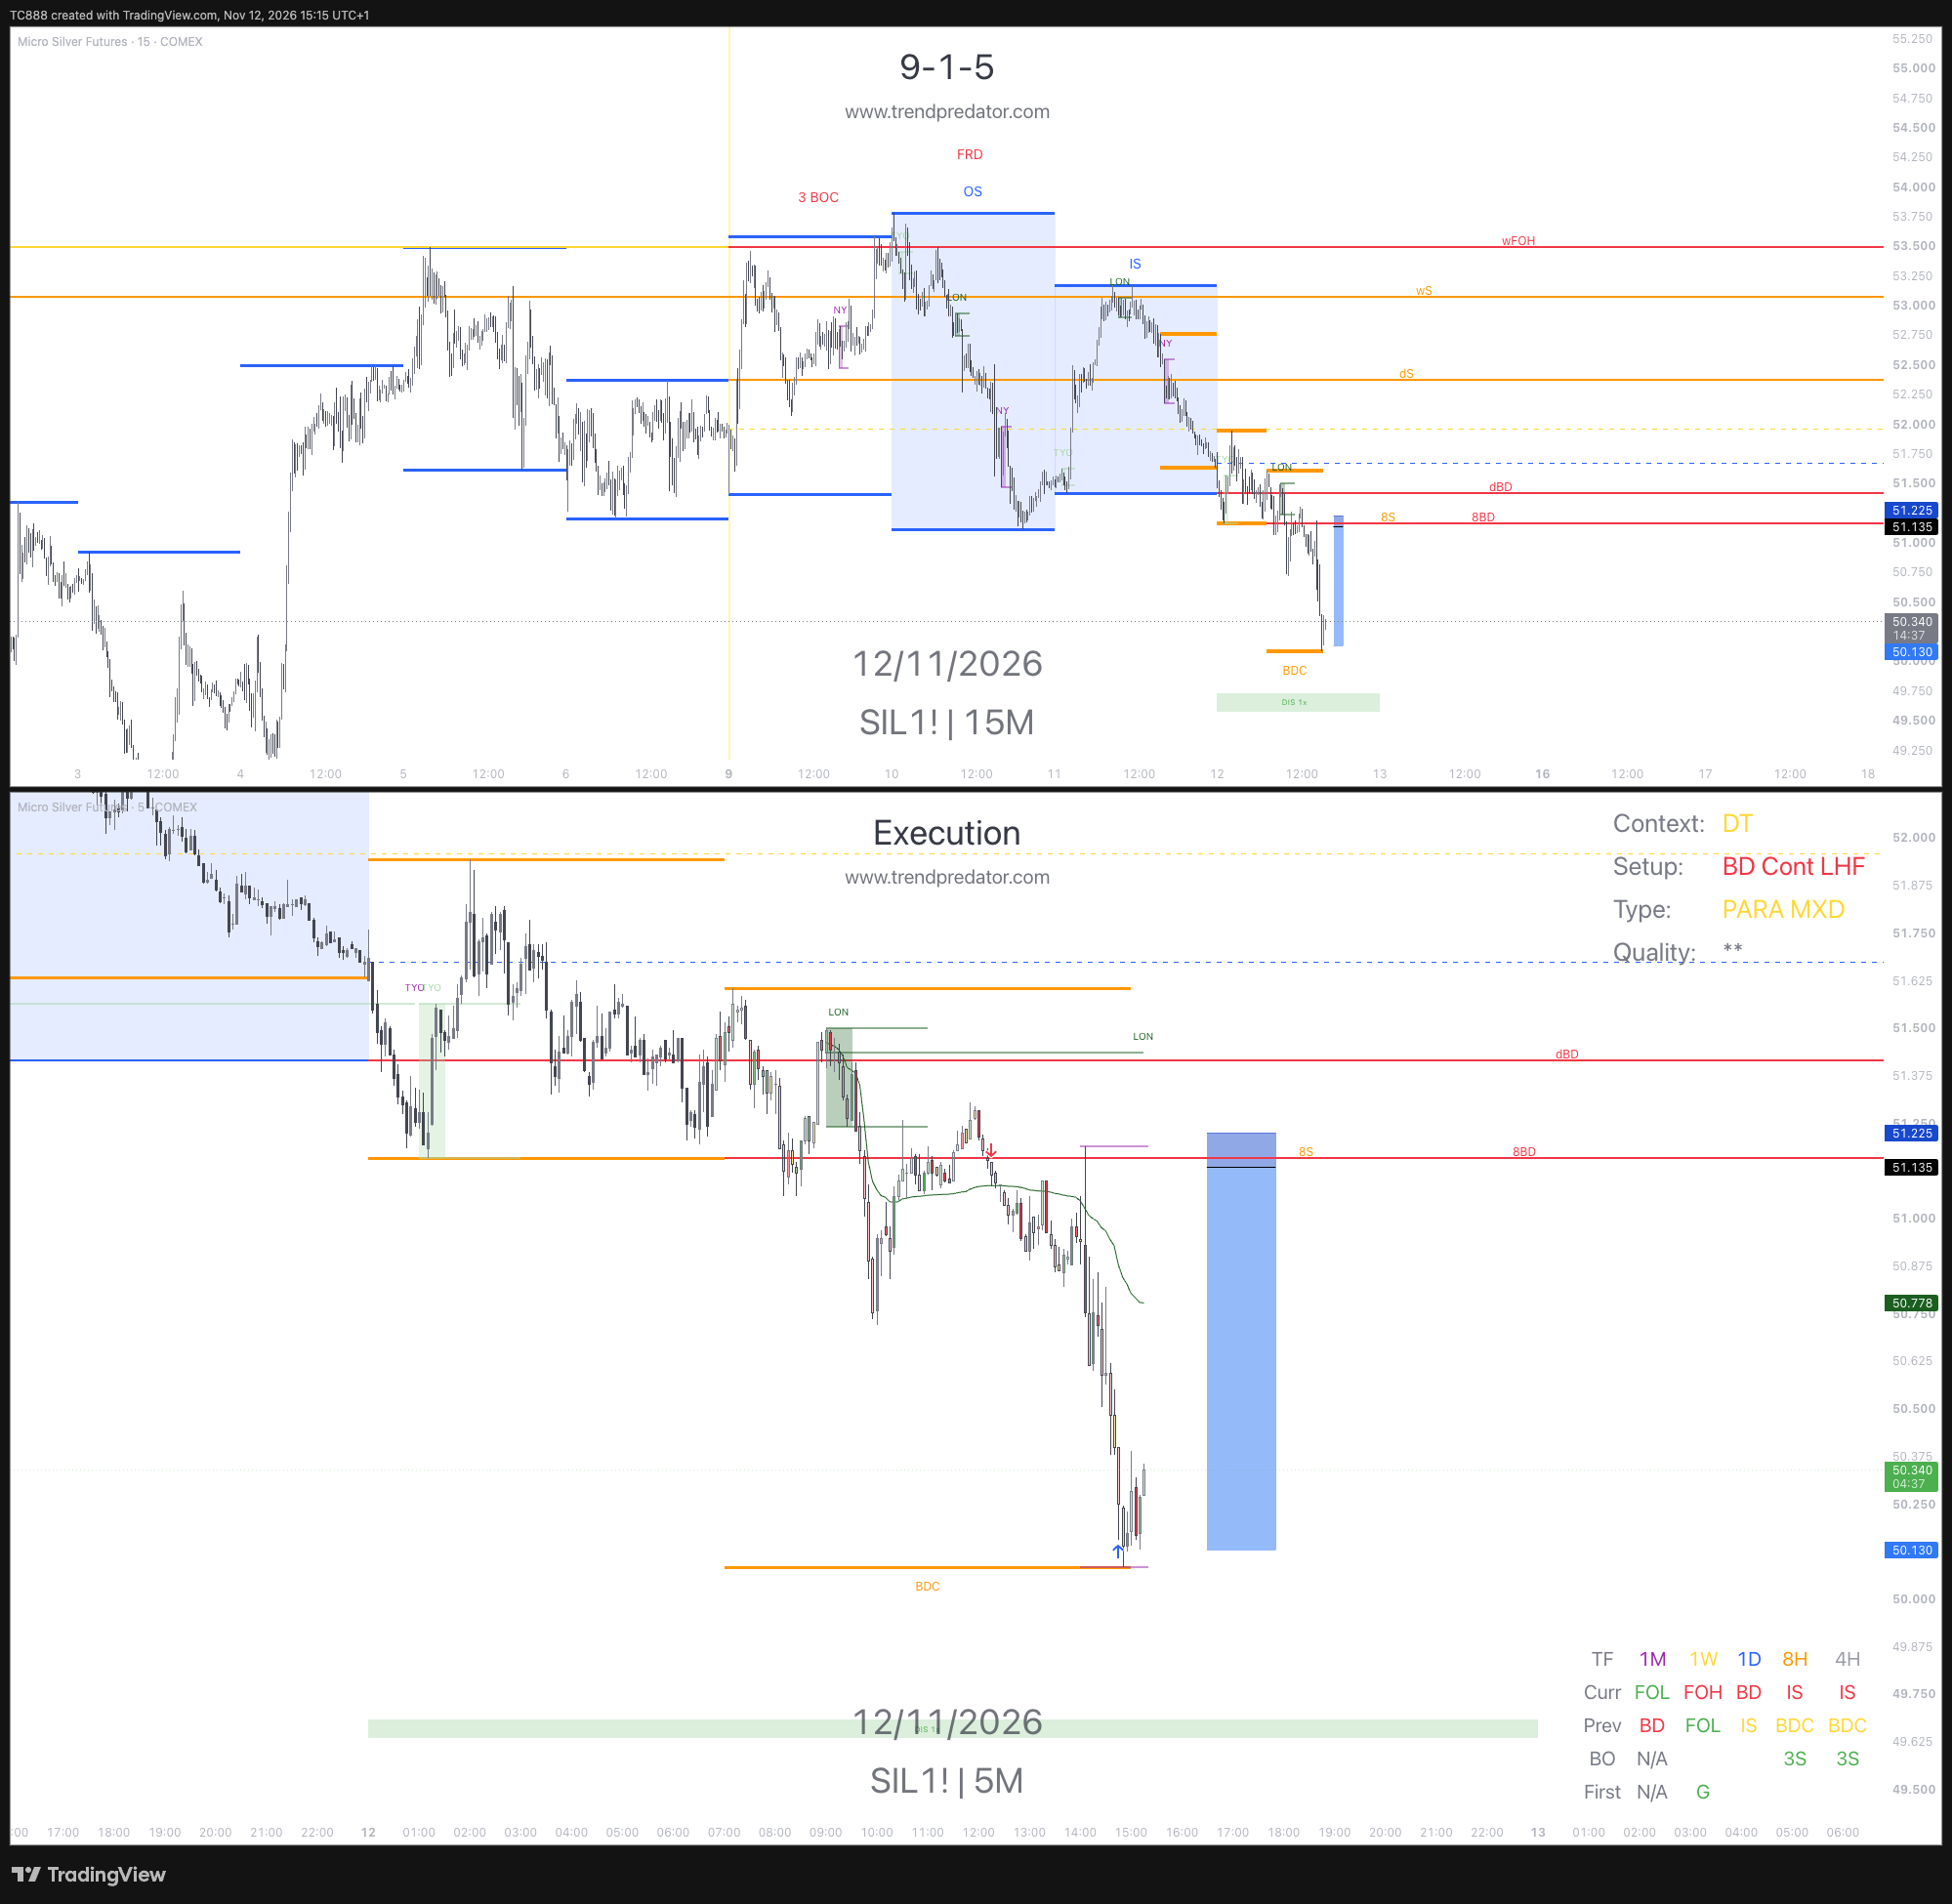
A higher-timeframe pullback into the downtrend, rolling over after 3 BOC / FRD. London had already made its first-mouse push down.
Entry explanation
Watched from the 11:00 rotation. The reported 12:15 entry followed price losing H8 again.
Target and development
The previous Wednesday’s value-area low was the target. A stop hunt into New York nearly stopped the trade before the target was reached about 2½ hours later.
Original full-resolution chart. Tap to enlarge. Entry time is reproduced as posted; its time convention has not been independently verified.
Matthias reported “1,000p / R12” for a half-size runner.
How to read this review. These are retrospective trade explanations. The later NY Prep discussion took place after the London entries, so it is not presented as pre-entry evidence. Exact fills and stops have not been independently verified. The two R figures must not be added together or interpreted as account performance.
04 / EXPLORE THE TEST
A separate NASDAQ backtest.
See the same reversal framework explored in a different market and session. The video includes losses, break-even trades, passes and missed trades alongside winners.
TC888 TRADING / 29:32
Struggling With Stacey Burke’s Reversals? NASDAQ Backtest
3 BOC / FRD → Daily and H8 alignment → Open Box breakdown → time rotations → management.
The 2026 NASDAQ backtest is separate from the Gold and Silver trades above. Its NASDAQ-specific stop and NY entry-window rules should not be transferred to these London examples. Backtest results exclude costs and slippage and do not predict future performance.